Full microscopic characterization of geological samples can be very complex, particularly in studies related to spatial distribution of mineral phases and composition of inclusions. Elemental, chemical and structural variations at the micro- or nano-scale are hard to observe using a single instrument. Evaluation by multiple techniques is key to understanding material properties. Application experts at Horiba Scientific and JEOL Europe recently highlighted a technique for precisely relocalizing specific areas between one instrument measurement and another, in order to perform comprehensive analysis of a pyrite sample with surrounding materials.
Introduction
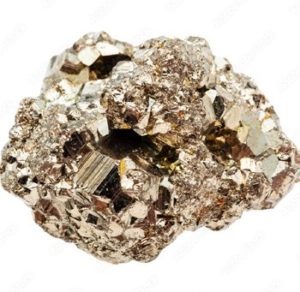
Pyrite is a brass-yellow mineral with a bright metallic luster. It has a chemical composition of iron sulfide (FeS2) and is the most common sulfide mineral. The selected sample occurs in a chrysotile vein intersecting a serpentinite meta-arkose. This type of metamorphic rock is the result of the interaction between sea water and peridotites, which are the rocks that make up the earth’s mantle.
Imaging techniques
Raman microscopy and scanning electron microscopy (SEM) including energy dispersive spectroscopy (EDS) were used to study the sample provided by the BRGM laboratory, France’s public institution for Earth Science applications. Thanks to their own specificities combined with a good spatial resolution, each of these techniques brings crucial information for mineral investigations.
Raman Microscopy is capable of characterizing the chemical composition and atomic structure of materials, as well as various mineral phases. In SEM, secondary electrons (SE) reflect the fine topographic structure of the sample, backscattered electrons (BSE) reflect the compositional distribution on the sample surface and EDS is used to determine the elements contained in the sample.
A critical point in this correlative microscopy study was achieving measurement of the same specific area on the sample using both the SEM and the Raman microscope. This challenge was overcome thanks to the Horiba nanoGPS SuiteTM which provides accurate relocalization between different instruments (navYXTM), as well as software for positioning multimodal maps in the same coordinate system (graphYXTM based on Mountains® technology).
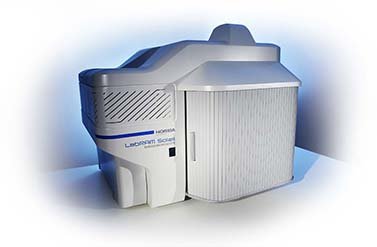
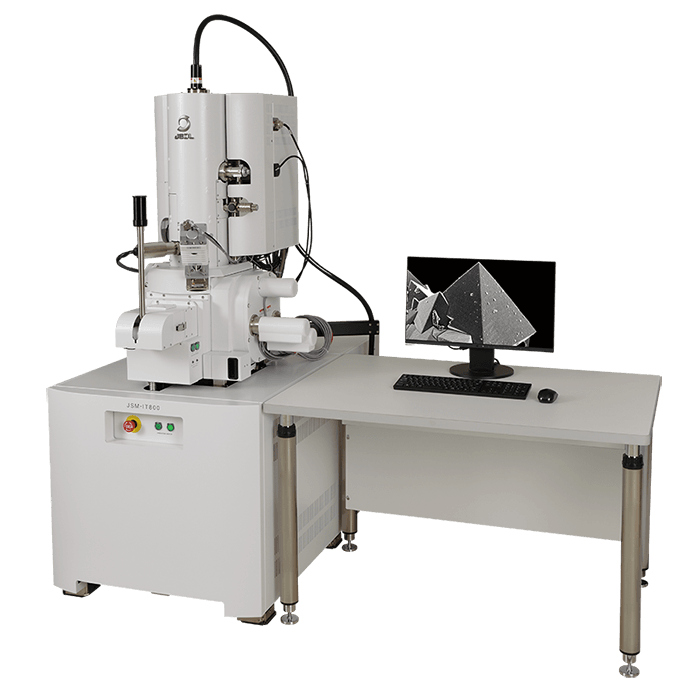
Above. Instrument technologies used in the study: HORIBA LabRAM SoleilTM Raman microscope and HORIBA F-CLUE Cathodoluminescence instrument coupled to IT800 SEM system from JEOL.
Results
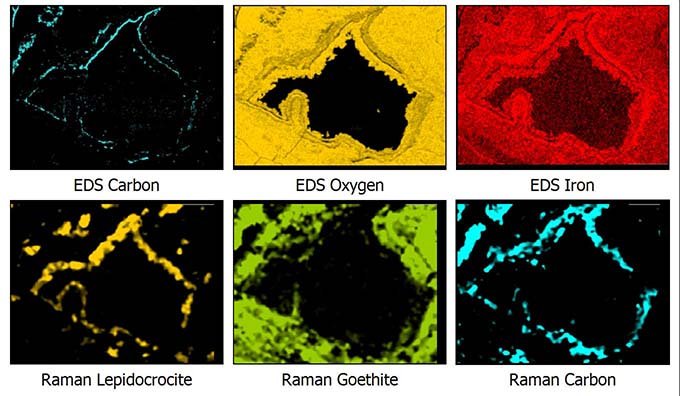
BSE imaging offers an easy and quick visualization of the specimen chemical variation, however, no chemical identification and characterization can be performed with this method. Therefore the first complementary technique applied to the sample was EDS mapping, which can bring information about the elemental composition, distribution and concentration. It is possible to observe the spatial distribution and the associated density of each chemical element detected by EDS.
To perform Raman analysis, the sample was then moved from the SEM chamber to the motorized stage of the Raman microscope. navYXTM technology allowed precise relocalization of the point of interest, enabling the Raman measurement at the same localization. With both EDS and Raman analysis, material phase identification was achieved for this sample, the EDS analysis helping to sort between matching results in the Raman database. Cathodoluminescence was also used to identify an Al inclusion.
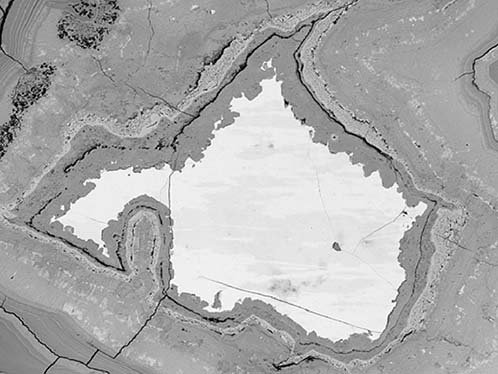
Above left. SEM BSE image of the analyzed area. Above right. Grid view of EDS & Raman maps.
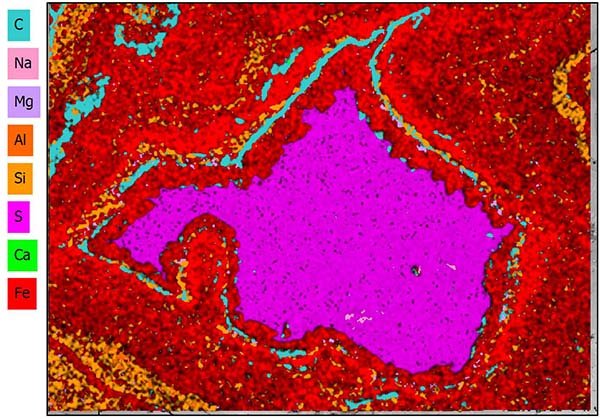
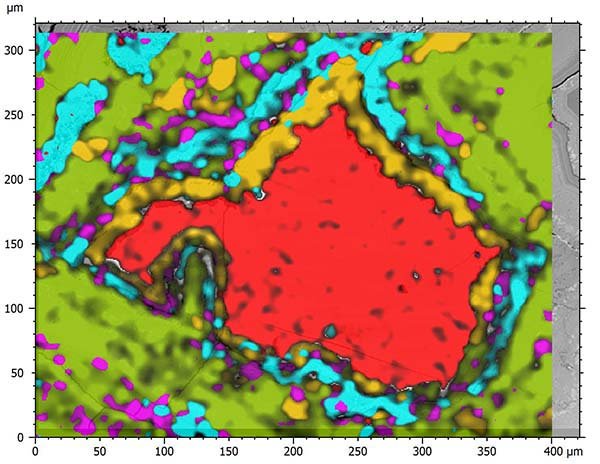
Above left. Colocalized EDS maps representing elements detected. Above right. Colocalized view of SEM image & Raman maps. Lepidocrocite and Goethite are clearly visible.
Conclusions
Raman measurement results associated with EDS mapping allowed the identification of the different minerals in the rings around the pyrite. Co-localization of measurements revealed the exact elemental and mineralogical make-up of the studied area. In particular, Lepidocrocite and Goethite, two minerals with the same chemical composition could not be identified using EDS mapping alone, but were successfully revealed thanks to Raman microscopy. The co-localization of different techniques and the complementary information leads to a complete knowledge of the specimen in question.
Instruments & software used
HORIBA LabRAM SoleilTM Raman microscope and HORIBA F-CLUE Cathodoluminescence instrument coupled to IT800 SEM system from JEOL + graphYXTM software based on MountainsSpectral®.